By NewsBTC - 1 年前 - 読書時間: 2 分
イーサリアムの価格が1,700ドルに戻り、1,800ドルが差し迫っているように見える、その理由は次のとおりです
Ethereum started a fresh increase and retested $1,700 against the US Dollar. ETH is showing positive signs and might rise further towards the $1,800 zone.
Ethereum gained pace and was able to clear the $1,660 resistance zone. The price is now trading above $1,660 and the 100 hourly simple moving average. There was a break above a key bearish trend line with resistance near $1,640 on the hourly chart of ETH/USD (data feed via Kraken). The pair could rise further if there is a clear move above the $1,700 resistance.Ethereum Price Reverses Losses
Ethereum price remained well bid above the $1,600 support, similar to bitcoin at $22,500. ETH formed a base above the $1,620 level and recently started a steady increase.
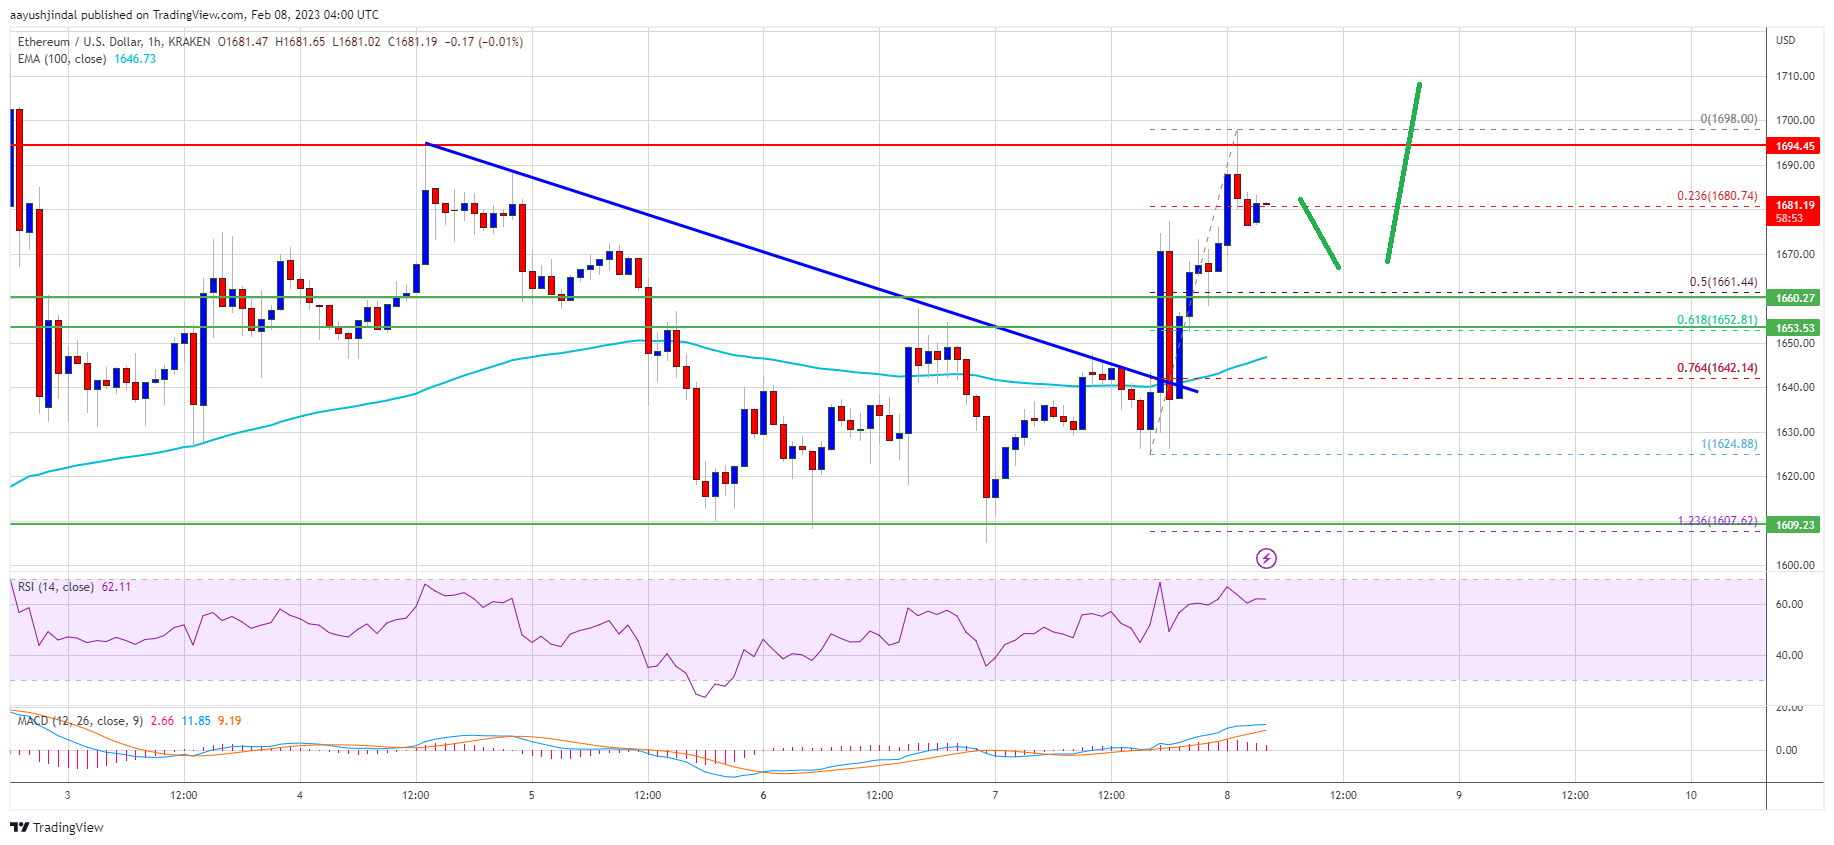
There was a clear move above the $1,650 and $1,660 resistance levels. Besides, there was a break above a key bearish trend line with resistance near $1,640 on the hourly chart of ETH/USD. The pair even retested the $1,700 resistance and formed a high at $1,698 before there was a minor decline.
イーサリアムの価格は現在1,660ドルを超えて取引されており、 100時間単位の単純移動平均. 23.6ドルのスイング安値から1,624ドルの高値への上昇の1,698%Fibリトレースメントレベル近くで取引されています。
An immediate resistance is near the $1,690 level. The next major resistance is near the $1,700 level. An upside break above the $1,700 resistance zone could spark a fresh increase. In the stated case, the price may perhaps rise towards the $1,750 resistance. Any more gains might send ether price towards the $1,820 resistance zone.
ETHでサポートされるディップ?
イーサリアムが 1,700 ドルのレジスタンスをクリアできなかった場合、別の下方修正が始まる可能性があります。 下値の最初のサポートは 1,660 ドル付近です。
The next major support is near the $1,650 zone or the 61.8% Fib retracement level of the upward move from the $1,624 swing low to $1,698 high. If there is a break below $1,650, the price might accelerate lower towards the $1,620 support. Any more losses might call for a test of the $1,600 support zone.
テクニカル指標
毎時MACD – ETH / USDのMACDは、強気ゾーンで勢いを失っています。
毎時RSI – ETH / USDのRSIは50レベルを超えています。
主なサポートレベル - $ 1,650
主な抵抗レベル - $ 1,700
元のソース: NewsBTC