By NewsBTC - 1 year ago - Reading Time: 2 minutes
Bitcoin Price Recovers Ground But This Resistance Is The Key For Upside
Bitcoin price is rising and trading above $23,000. BTC could gain bullish momentum if there is a clear move above the $23,500 resistance zone.
Bitcoin is correcting losses and trading above the $23,000 support zone. The price is trading above $23,000 and the 100 hourly simple moving average. There was a break above a crucial bearish trend line with resistance near $23,000 on the hourly chart of the BTC/USD pair (data feed from Kraken). The pair could rise further and move into a bullish zone if it clears the $23,500 resistance.Bitcoin Price Forms Decent Support
Bitcoin price remained well bid above the $22,500 support. A base was formed above $22,500 and BTC started a decent recovery wave. There was a clear move above the $22,800 and $23,000 resistance levels.
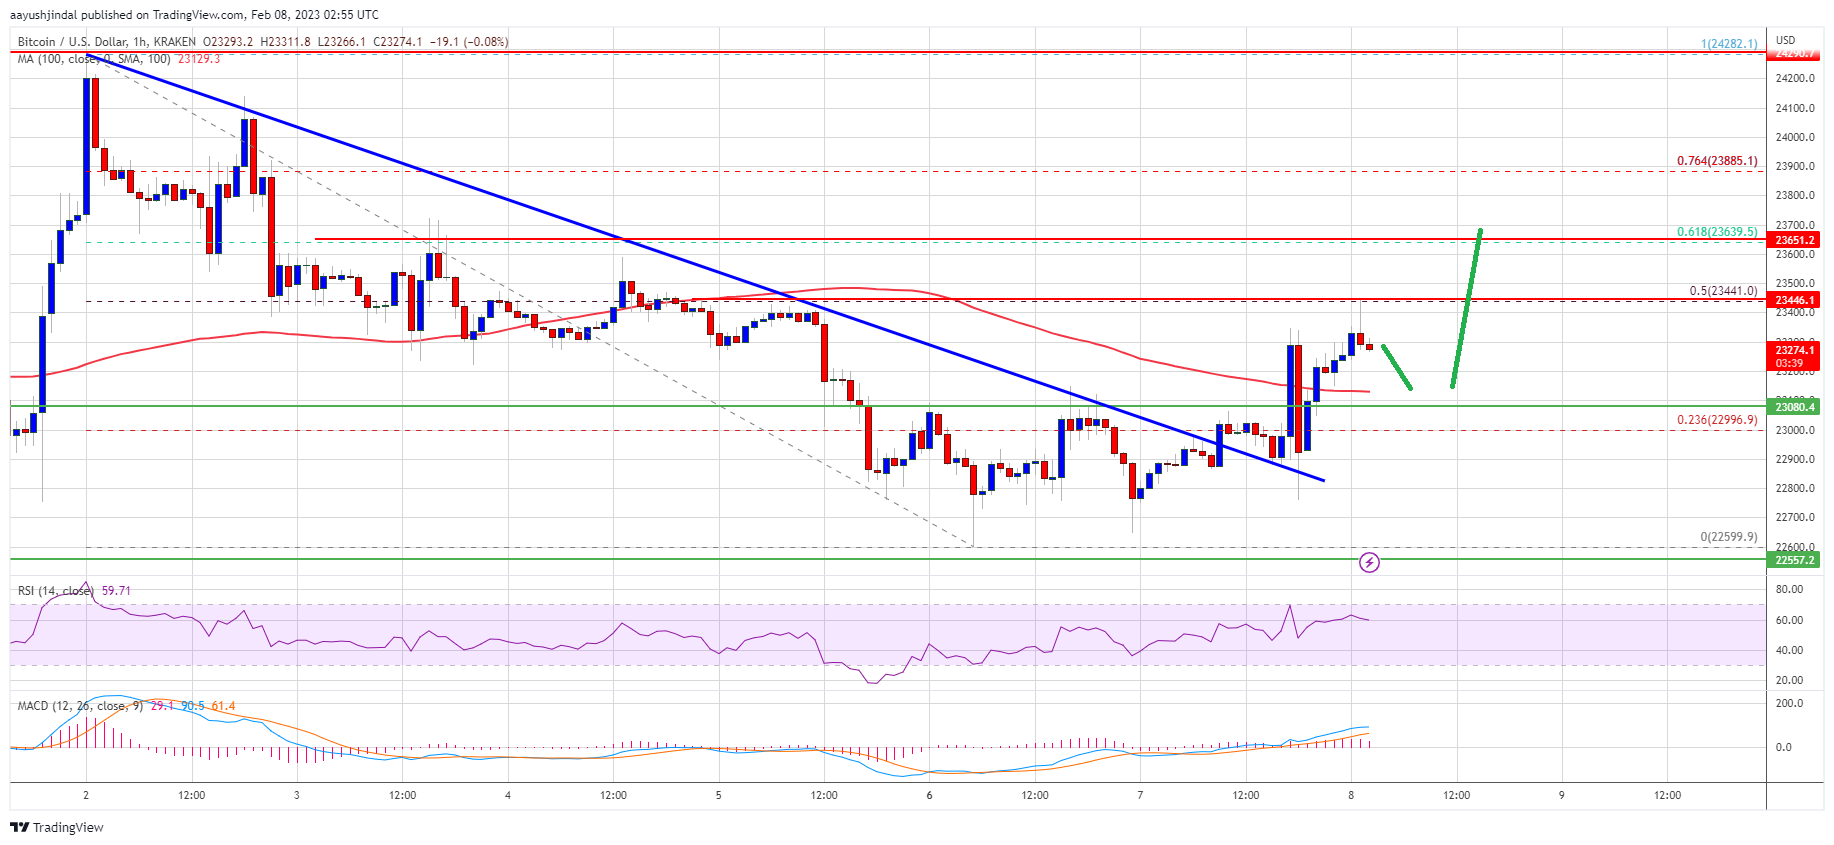
There was also a break above a crucial bearish trend line with resistance near $23,000 on the hourly chart of the BTC/USD pair. The pair climbed above the 23.6% Fib retracement level of the key decline from the $24,282 swing high to $22,599 low.
Bitcoin price is trading above $23,000 and the 100 hourly simple moving average. An immediate resistance is near the $23,450 zone. It is near the 50% Fib retracement level of the key decline from the $24,282 swing high to $22,599 low.
Source: BTCUSD on TradingView.com
The next major resistance is near the $23,500 zone. A clear move above the $23,500 resistance might start a steady increase. In the stated case, the price may perhaps jump towards the $24,000 level. The next resistance could be near the $24,250 level, above which btc price might rise towards the $25,000 resistance zone.
Dips Supported in BTC?
If bitcoin price fails to clear the $23,500 resistance, it could start another downside correction. An immediate support on the downside is near the $23,000 zone and the 100 hourly simple moving average.
The next major support is near the $22,800 zone. A downside break below the $22,800 zone might send the price towards the $22,600 zone. Any more losses might call for a test of the $22,500 support in the near term.
Technical indicators:
Hourly MACD – The MACD is now losing pace in the bullish zone.
Hourly RSI (Relative Strength Index) – The RSI for BTC/USD is now above the 50 level.
Major Support Levels – $23,000, followed by $22,800.
Major Resistance Levels – $23,450, $23,500 and $24,000.
Original source: NewsBTC